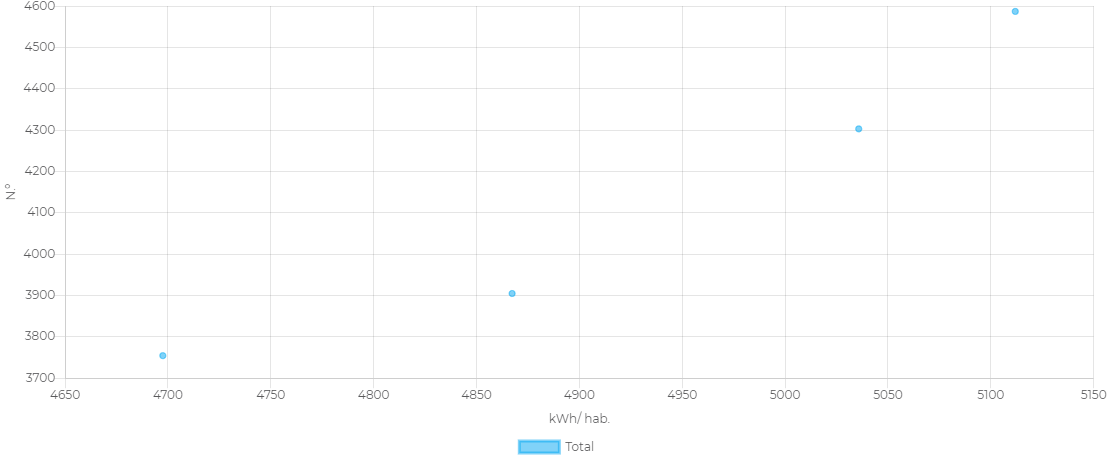
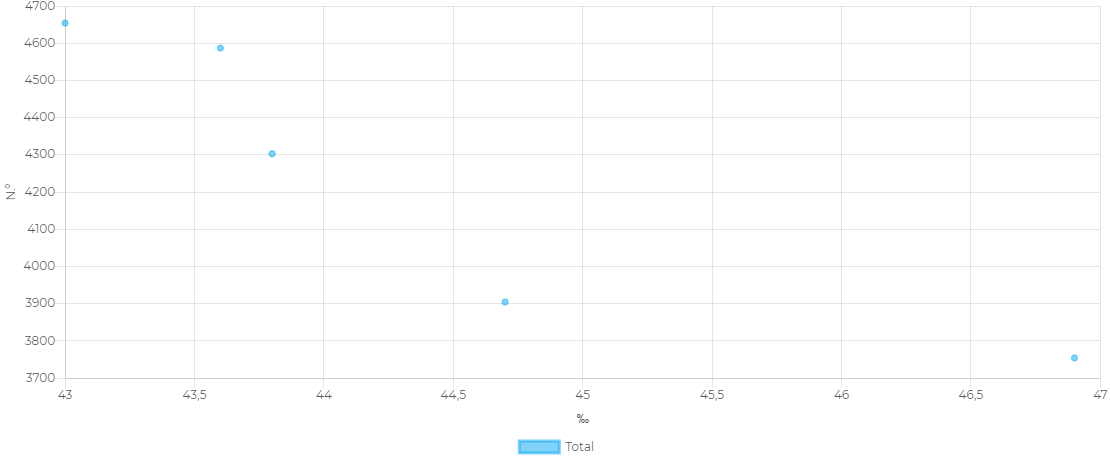
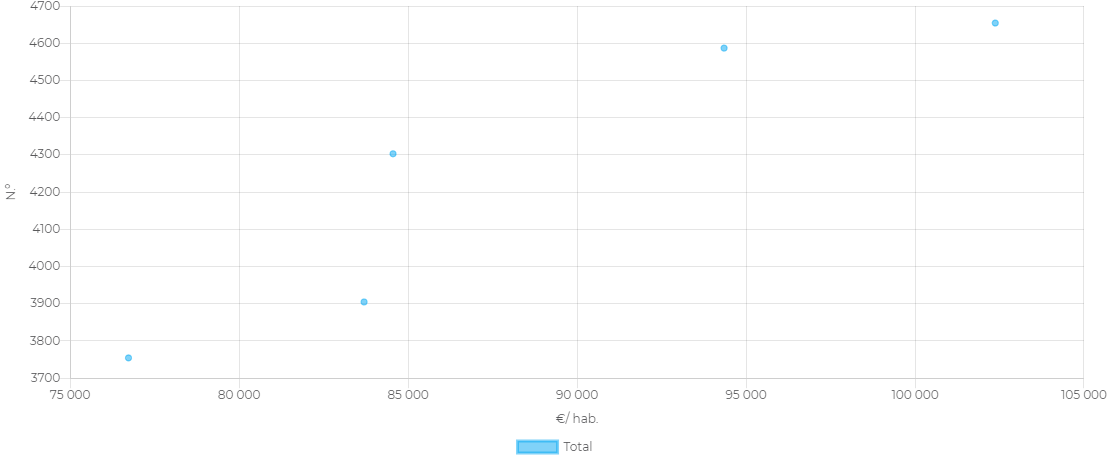
Relative contribution of establishments, food and beverage service activities to the Algarve Economy (GVA of Enterprises) vs Revenue per available room (Rev Par) of hotel establishments
Annual
Data for
Algarve
as a function of
relative contribution of establishments, food and beverage service activities to the algarve economy (gva)
Zoom
Relationship between relative contribution of establishments, food and beverage service activities to the Algarve Economy (GVA of Enterprises) and revenue per available room (Rev Par) of hotel establishments.
-
-
Not applicable (-)
Annual
Impact
INE / INE
INE / INE
2009 - 2017
| Years | Accommodation and food service activities |
|---|---|
| 2009 | (20.470; 29.900) |
| 2010 | (20.880; 29.700) |
| 2011 | (24.080; 31.200) |
| 2012 | (24.860; 31.600) |
| 2013 | (25.810; 33.200) |
| 2014 | (25.820; 34.700) |
| 2015 | (26.800; 40.500) |
| 2016 | (29.730; 46.100) |
| 2017 | (29.640; 51.900) |