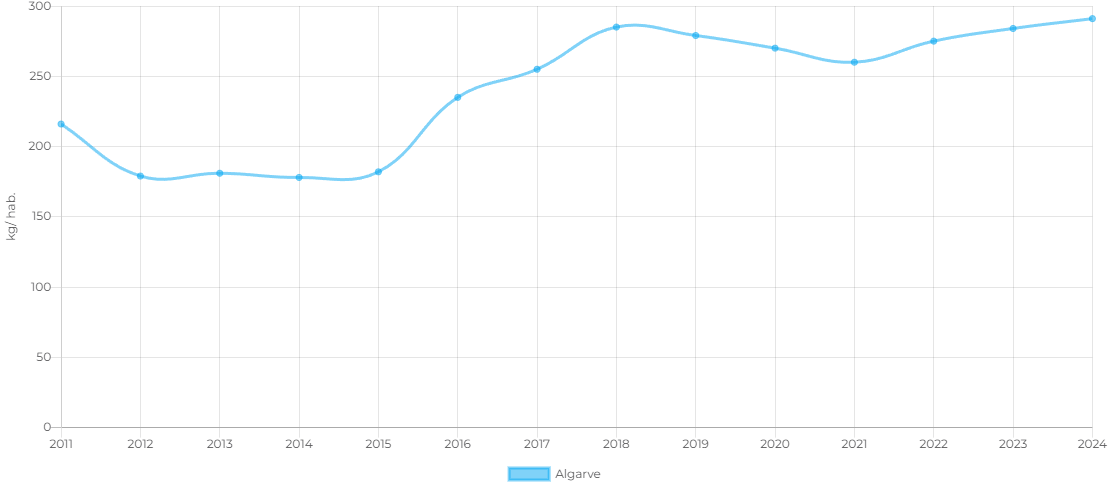
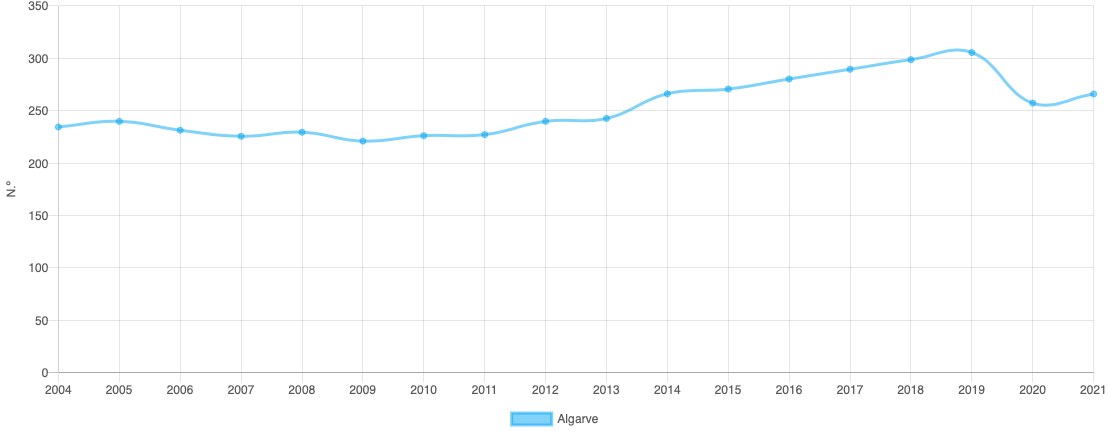
Urban waste collected per capita
Annual
Data for
all locations
as a function of
location
Zoom
Continente per capita (kg/ inh./ day)
1.33
Urban waste from household as well as other waste which by its composition or characteristics is similar, collected per inhabitant per day.
(Urban solid waste collected/ Annual average resident population)/ 365
Retrieved from Urban waste statistics.
Kilogramme/ Inhabitant/ Day (Kg/ hab./ dia)
Annual
Status
INE
INE
2011 - 2017
| Years | Algarve | Albufeira | Alcoutim | Aljezur | Castro Marim | Faro | Lagoa | Lagos | Loulé | Monchique | Olhão | Portimão | São Brás de Alportel | Silves | Tavira | Vila do Bispo | Vila Real de Santo António | Barlavento | Sotavento |
|---|---|---|---|---|---|---|---|---|---|---|---|---|---|---|---|---|---|---|---|
| 2011 | 2.31 | 3.96 | 1.31 | 1.93 | 2.66 | 1.69 | 2.87 | 2.42 | 2.41 | 1.53 | 1.87 | 2.29 | 1.53 | 1.87 | 2.05 | 3.25 | 2.48 | 2.52 | 2.00 |
| 2012 | 2.08 | 3.49 | 1.25 | 1.80 | 2.38 | 1.57 | 2.56 | 2.18 | 2.22 | 1.50 | 1.61 | 2.08 | 1.41 | 1.61 | 1.88 | 2.94 | 2.23 | 2.27 | 1.82 |
| 2013 | 2.04 | 2.95 | 1.43 | 2.03 | 2.23 | 1.70 | 2.45 | 2.26 | 2.09 | 1.66 | 1.51 | 2.09 | 1.45 | 1.76 | 1.98 | 2.91 | 2.16 | 2.26 | 1.82 |
| 2014 | 2.09 | 3.07 | 1.44 | 2.15 | 2.30 | 1.74 | 2.49 | 2.33 | 2.16 | 1.78 | 1.61 | 2.04 | 1.53 | 1.84 | 1.96 | 2.92 | 2.16 | 2.33 | 1.86 |
| 2015 | 2.16 | 3.62 | 1.26 | 2.06 | 2.34 | 1.67 | 2.76 | 2.31 | 2.30 | 1.62 | 1.61 | 2.04 | 1.45 | 1.75 | 1.96 | 3.11 | 2.24 | 2.41 | 1.85 |
| 2016 | 2.29 | 3.68 | 1.34 | 2.16 | 2.64 | 1.81 | 2.94 | 2.38 | 2.59 | 1.58 | 1.66 | 2.08 | 1.45 | 1.79 | 2.13 | 3.42 | 2.53 | 2.50 | 2.02 |
| 2017 | 2.41 | 3.80 | 1.46 | 2.38 | 2.85 | 1.86 | 2.96 | 2.48 | 2.71 | 1.70 | 1.78 | 2.25 | 1.52 | 1.96 | 2.32 | 3.77 | 2.65 | 2.66 | 2.14 |
Who saw this indicator also viewed:
0
Preview unavailable
Charging stations for eletric vehicles
Not periodic
