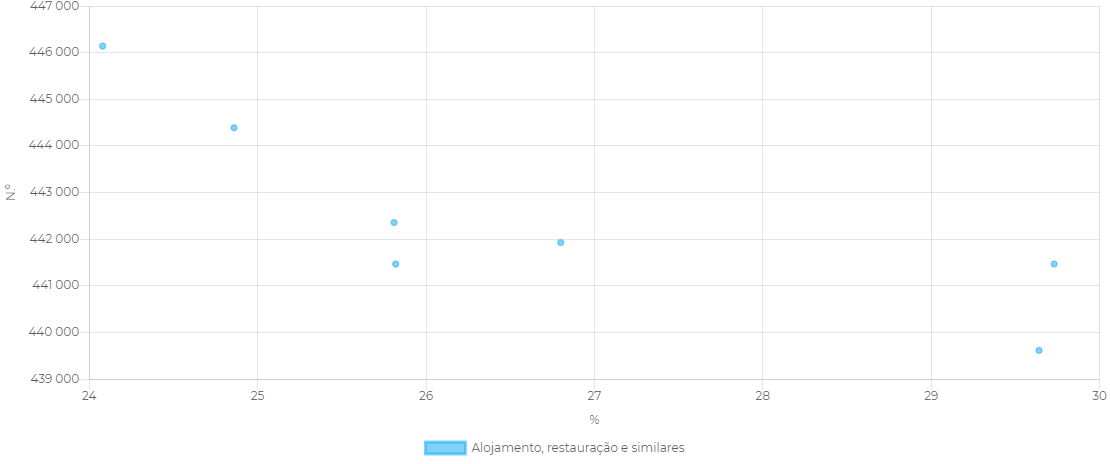
Resíduos urbanos recolhidos selectivamente por habitante
Anual
Dados para
todas as localizações
em função de
localização
Zoom
Continente (kg/ hab.)
88
Recolha especial de resíduos que são objeto de deposição separada por parte do detentor, com a finalidade de serem reciclados (Ex.: os vidrões e os denominados "ecopontos") em relação à população média residente.
Resíduos urbanos recolhidos selectivamente/ População média anual residente
Retirado das Estatísticas dos resíduos urbanos.
Quilograma/ Habitante (kg/ hab.)
Anual
Pressão
INE
INE
2011 - 2024
| Anos | Algarve | Albufeira | Alcoutim | Aljezur | Castro Marim | Faro | Lagoa | Lagos | Loulé | Monchique | Olhão | Portimão | São Brás de Alportel | Silves | Tavira | Vila do Bispo | Vila Real de Santo António |
|---|---|---|---|---|---|---|---|---|---|---|---|---|---|---|---|---|---|
| 2011 | 216 | 491 | 58 | 109 | 201 | 124 | 279 | 217 | 225 | 63 | 202 | 251 | 110 | 118 | 147 | 308 | 183 |
| 2012 | 179 | 402 | 57 | 104 | 152 | 102 | 225 | 177 | 204 | 73 | 136 | 226 | 94 | 87 | 117 | 273 | 144 |
| 2013 | 181 | 226 | 129 | 190 | 154 | 142 | 198 | 224 | 173 | 162 | 120 | 261 | 133 | 156 | 171 | 217 | 159 |
| 2014 | 178 | 226 | 98 | 198 | 129 | 145 | 203 | 224 | 172 | 174 | 153 | 230 | 134 | 158 | 147 | 226 | 131 |
| 2015 | 182 | 286 | 40 | 185 | 119 | 117 | 316 | 238 | 191 | 119 | 133 | 247 | 118 | 118 | 118 | 302 | 92 |
| 2016 | 235 | 422 | 70 | 173 | 229 | 143 | 363 | 224 | 301 | 83 | 158 | 256 | 122 | 168 | 168 | 307 | 232 |
| 2017 | 255 | 429 | 83 | 207 | 284 | 152 | 344 | 247 | 317 | 104 | 187 | 285 | 138 | 204 | 191 | 362 | 261 |
| 2018 | 285 | 460 | 104 | 313 | 337 | 168 | 354 | 297 | 362 | 128 | 215 | 305 | 159 | 223 | 222 | 661 | 226 |
| 2019 | 279 | 412 | 126 | 277 | 298 | 172 | 398 | 304 | 342 | 138 | 211 | 306 | 182 | 234 | 232 | 353 | 236 |
| 2020 | 270 | 386 | 121 | 271 | 310 | 162 | 343 | 291 | 322 | 131 | 221 | 280 | 176 | 207 | 222 | 897 | 253 |
| 2021 | 260 | 359 | 78 | 262 | 340 | 163 | 400 | 271 | 330 | 105 | 217 | 286 | 154 | 189 | 196 | 377 | 229 |
| 2022 | 275 | 375 | 92 | 282 | 300 | 153 | 443 | 305 | 359 | 113 | 230 | 312 | 156 | 194 | 207 | 370 | 233 |
| 2023 | 284 | 345 | 80 | 259 | 253 | 145 | 426 | 297 | 506 | 101 | 221 | 283 | 142 | 185 | 189 | 367 | 227 |
| 2024 | 291 | 351 | 100 | 264 | 252 | 119 | 440 | 312 | 509 | 114 | 232 | 298 | 166 | 234 | 196 | 375 | 196 |