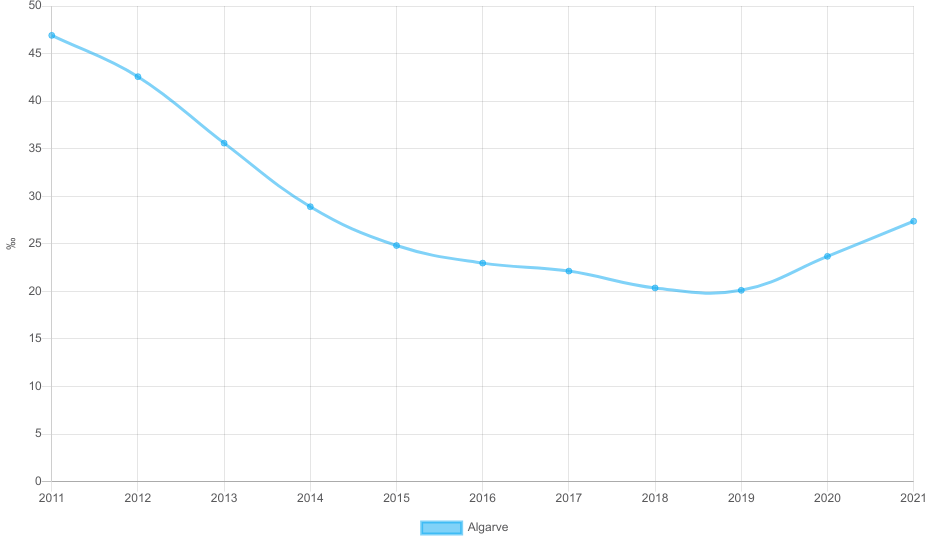
Saldos populacionais anuais: natural e migratório
Anual
Dados para
todas as localizações
em função de
saldo populacional
Zoom
O saldo populacional é a diferença entre o número de pessoas que habitam num determinado local no final e no início de um determinado período. Este valor resulta da combinação do saldo migratório (diferença entre o número de pessoas que imigram e o número de pessoas que emigram) e o saldo natural (diferença entre o número de nados-vivos e o número de óbitos).
Saldo Natural = [Nados vivos - Óbitos]
Saldo Migratório = [Nº imigrantes - Nº emigrantes]
Retirado de Indicadores demográficos.
Número (N.º)
Anual
Estado
INE
INE
2011 - 2022
| Anos | Saldo natural | Saldo natural | Saldo natural | Saldo natural | Saldo natural | Saldo natural | Saldo natural | Saldo natural | Saldo natural | Saldo natural | Saldo natural | Saldo natural | Saldo natural | Saldo natural | Saldo natural | Saldo natural | Saldo natural | Saldo migratório | Saldo migratório | Saldo migratório | Saldo migratório | Saldo migratório | Saldo migratório | Saldo migratório | Saldo migratório | Saldo migratório | Saldo migratório | Saldo migratório | Saldo migratório | Saldo migratório | Saldo migratório | Saldo migratório | Saldo migratório | Saldo migratório |
|---|---|---|---|---|---|---|---|---|---|---|---|---|---|---|---|---|---|---|---|---|---|---|---|---|---|---|---|---|---|---|---|---|---|---|
| 2011 | 102 | -137 | -53 | -1 | 113 | 0 | -44 | 4 | -57 | -28 | -64 | -46 | 29 | -106 | 170 | 72 | -82 | -346 | -218 | -61 | -186 | -502 | -31 | -64 | -259 | -56 | -103 | -5 100 | -75 | -686 | -275 | -615 | -1 514 | -109 |
| 2012 | -13 | -127 | -61 | -38 | -39 | -33 | -49 | -31 | -45 | -46 | -673 | -36 | -76 | -115 | 112 | 7 | -83 | 72 | 20 | -30 | 23 | -17 | 18 | -14 | 2 | 39 | 68 | -1 077 | -10 | -76 | 59 | -273 | -910 | -48 |
| 2013 | -80 | -153 | -68 | -55 | -43 | -24 | -41 | -67 | -53 | -78 | -1 050 | -35 | -143 | -149 | 111 | -94 | -78 | 65 | 24 | -28 | 22 | -14 | 17 | -10 | 11 | 39 | 67 | -982 | -10 | -56 | 61 | -254 | -871 | -45 |
| 2014 | -85 | -150 | -66 | -62 | -5 | -33 | -57 | -88 | -41 | -58 | -929 | -49 | -72 | -156 | 94 | -47 | -54 | 59 | 37 | -19 | 35 | 82 | 19 | 13 | 82 | 34 | 54 | 39 | -1 | 110 | 82 | -34 | -488 | -26 |
| 2015 | -34 | -169 | -52 | -18 | 4 | -24 | -45 | -83 | -6 | -51 | -742 | -58 | -41 | -174 | 112 | -36 | -67 | 112 | 73 | -10 | 82 | 206 | 28 | 31 | 147 | 50 | 76 | 1 203 | 15 | 264 | 159 | 138 | -159 | -9 |
| 2016 | -67 | -134 | -73 | -33 | -94 | -26 | -31 | -102 | -53 | -32 | -1 039 | -58 | -150 | -173 | 92 | -32 | -73 | -43 | -18 | -6 | 45 | 108 | 12 | 25 | 38 | 14 | -2 | 579 | 10 | 41 | 102 | 184 | 86 | -17 |
| 2017 | -111 | -152 | -74 | -29 | -61 | -29 | -31 | -100 | -60 | -40 | -1 051 | -59 | -93 | -218 | 132 | -53 | -73 | -183 | -97 | -11 | -17 | -61 | -2 | 7 | -71 | -17 | -59 | -801 | -7 | -207 | 0 | 59 | -100 | -35 |
| 2018 | -92 | -195 | -61 | -48 | 6 | -19 | -17 | -103 | -53 | -19 | -957 | -73 | -100 | -208 | 74 | 10 | -59 | -150 | -69 | -13 | 43 | 79 | 12 | 31 | 2 | 10 | -37 | 204 | 11 | -71 | 124 | 225 | 44 | -37 |
| 2019 | -24 | -147 | -72 | -28 | -27 | -13 | -46 | -85 | -7 | -98 | -709 | -49 | -115 | -81 | 136 | 10 | -63 | -178 | -73 | -13 | 42 | 94 | 13 | 41 | 17 | 7 | -41 | 251 | 12 | -61 | 133 | 269 | 31 | -42 |
| 2020 | -132 | -212 | -78 | -66 | -8 | -22 | -35 | -167 | -58 | -99 | -1 080 | -53 | -62 | -119 | 146 | -41 | -74 | -95 | -24 | -4 | 47 | 124 | 15 | 39 | 61 | 14 | -11 | 644 | 14 | 51 | 125 | 247 | 65 | -24 |
| 2021 | -177 | -201 | -68 | -36 | -150 | -25 | -51 | -159 | -38 | -104 | -1 743 | -50 | -275 | -187 | 65 | -202 | -85 | -77 | 31 | 36 | 280 | 319 | 74 | 98 | 64 | 94 | 49 | 1 834 | 137 | -112 | 493 | 257 | 73 | 18 |
| 2022 | -199 | -195 | -78 | -110 | -39 | -36 | -41 | -134 | -62 | -112 | -1 772 | -54 | -285 | -206 | 16 | -159 | -78 | - | - | - | - | - | - | - | - | - | - | - | - | - | - | - | - | - |
Quem viu este indicator também viu:
0
Pré-visualização indisponível
Postos de carregamento para veículos elétricos
Não periódico
