Loading...

Urban waste collected per capita vs Per capita purchasing power

Biennial
Indicator filters
You are in advanced search mode: The choice you make has (or may have) limited data visibility
Data for Algarve as a function of urban waste collected per capita
Zoom

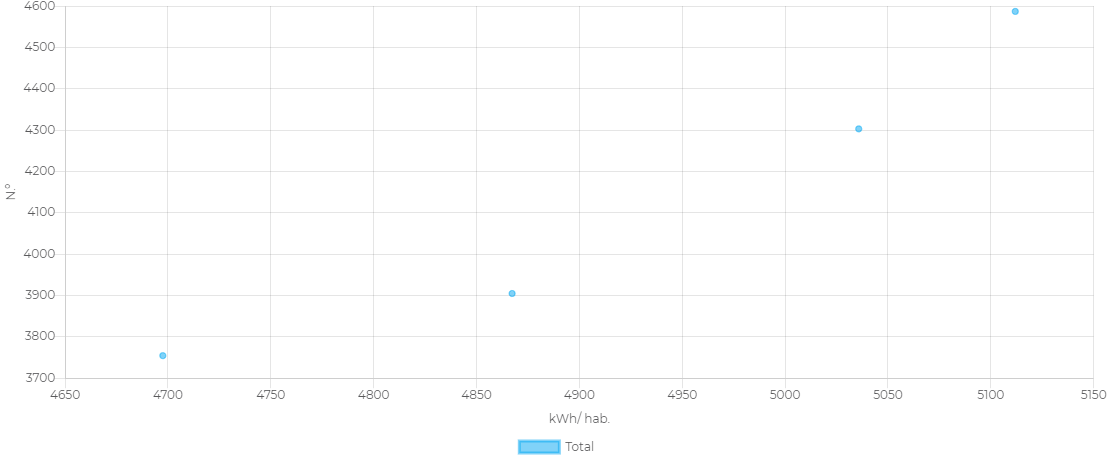
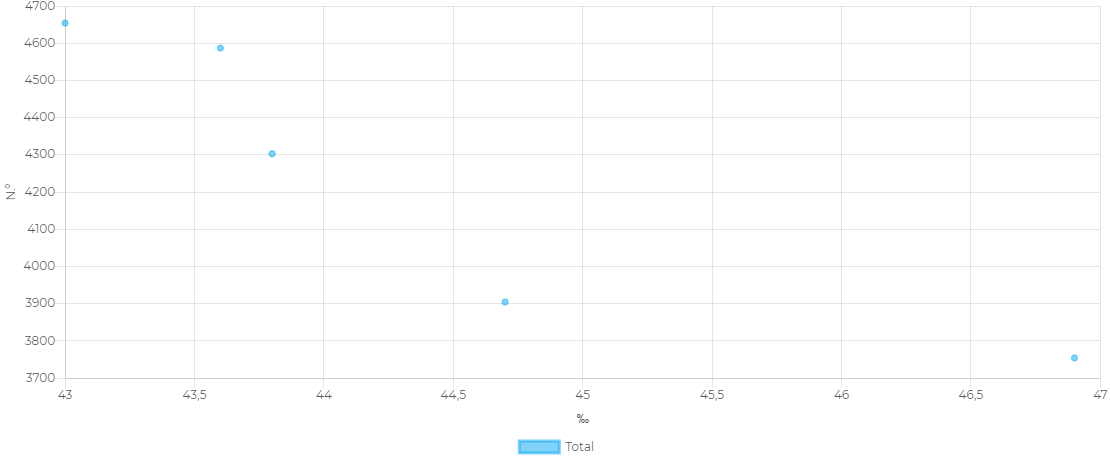
Relationship between urban waste collected per capita and per capita purchasing power.

-

-

Not applicable (-)

Biennial

Status


INE / INE

INE / INE

2011 - 2015


Years Total
2011 (2.310; 96.740)
2013 (2.040; 96.380)
2015 (2.160; 95.170)
Download spreadsheet