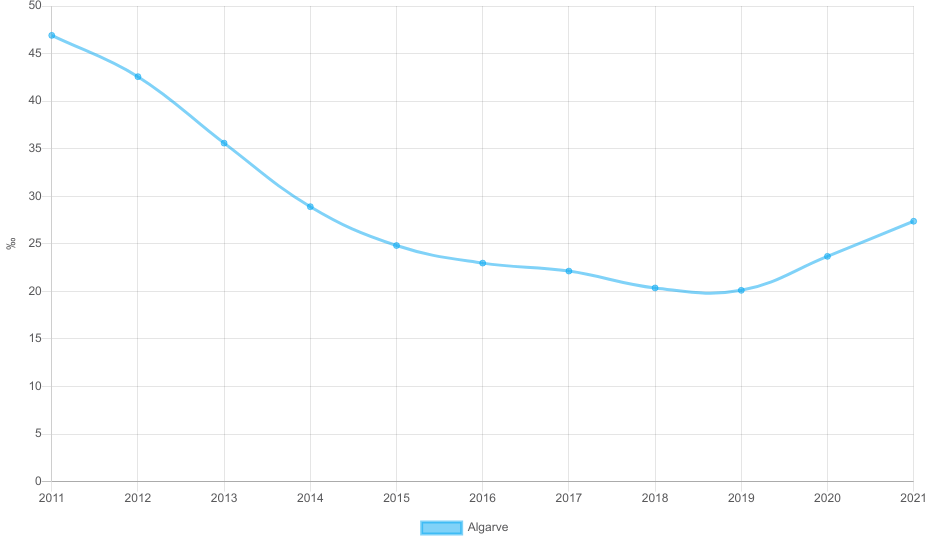
Relative contribution of establishments, food and beverage service activities to the Algarve Economy (GVA of Enterprises)
Annual
Data for
Algarve
as a function of
economic activity (division - cae rev. 3)
Zoom
Algarve (€)
2,947,518,306
Gross production value less the cost of rawmaterials and other consumption in the production process (GVA) in accommodation, food and beverage service activities, and their contribution into the region.
(GVA accommodation, food and beverage service activities in Algarve/ GVA Algarve)*100
Retrieved from Integrated business accounts system.
Percentage (%)
Annual
Impact
INE
INE
2008 - 2021
| Years | Accommodation | Food and beverage service activities |
|---|---|---|
| 2008 | 9.72 | 9.94 |
| 2009 | 9.66 | 10.81 |
| 2010 | 9.93 | 10.95 |
| 2011 | 11.88 | 12.20 |
| 2012 | 13.85 | 11.01 |
| 2013 | 14.40 | 11.41 |
| 2014 | 14.52 | 11.30 |
| 2015 | 15.25 | 11.55 |
| 2016 | 17.16 | 12.57 |
| 2017 | 16.64 | 12.99 |
| 2018 | 16.88 | 12.85 |
| 2019 | 16.38 | 12.91 |
| 2020 | 8.07 | 8.89 |
| 2021 | 11.06 | 9.75 |