Air quality index
Annual
Data for
Aglomeração Sul and Algarve
as a function of
index (no. days)
Zoom
The Air Quality Index (IQar) for a given area results from the arithmetic average calculated for each of the pollutants measured at all network stations in that area. The values thus determined are compared with the concentration ranges associated with a color scale and the pollutants with the highest concentration are responsible for the IQar.
Arithmetic average calculated for each of the pollutants measured in all network stations of that area.
Retrieved from Air Quality Index. Aglomeração Sul corresponds to the locations Albufeira, Faro, and Portimão.
Number of days (N.º Dias)
Annual
Status
APA
APA
2012 - 2018
| Years | Very Good (Aglomeração Sul) | Very Good (Algarve) | Good (Aglomeração Sul) | Good (Algarve) | Average (Algarve) | Average (Aglomeração Sul) | Weak (Algarve) | Weak (Aglomeração Sul) | Bad (Aglomeração Sul) | Bad (Algarve) |
|---|---|---|---|---|---|---|---|---|---|---|
| 2012 | 0 | 4 | 0 | 182 | 40 | 0 | 4 | 0 | 0 | 0 |
| 2013 | 0 | 3 | 0 | 241 | 47 | 0 | 0 | 0 | 0 | 0 |
| 2014 | 15 | 9 | 313 | 263 | 14 | 32 | 3 | 5 | 0 | 0 |
| 2015 | 5 | 1 | 307 | 287 | 39 | 46 | 10 | 7 | 0 | 0 |
| 2016 | 4 | 2 | 314 | 262 | 29 | 36 | 2 | 5 | 1 | 1 |
| 2017 | 6 | 0 | 289 | 91 | 11 | 57 | 0 | 13 | 0 | 0 |
| 2018 | 1 | 0 | 311 | 265 | 27 | 47 | 2 | 6 | 0 | 0 |
Who saw this indicator also viewed:
5
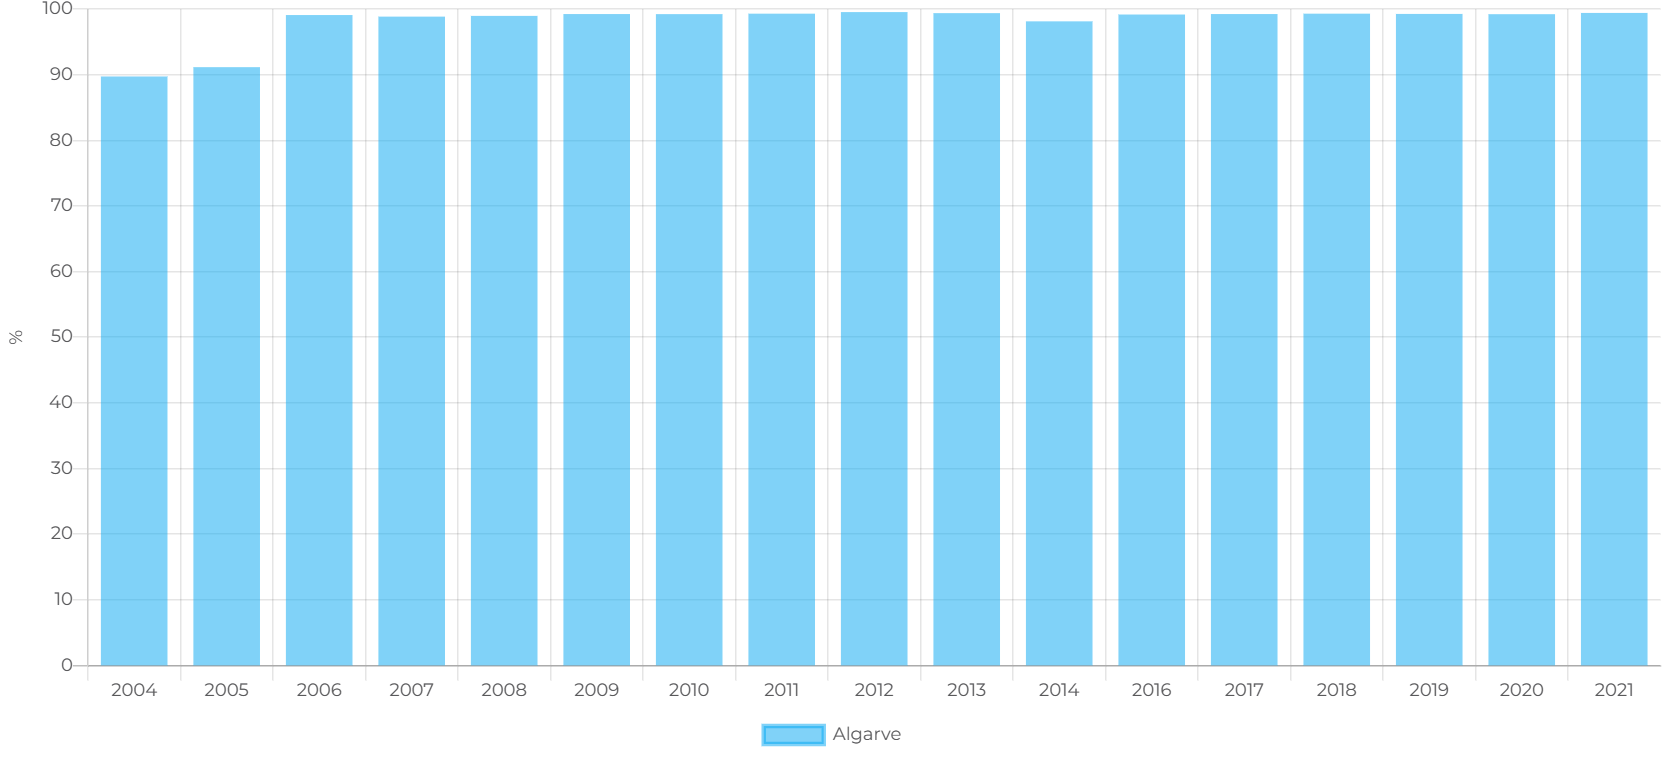
% Safe water
Annual
0
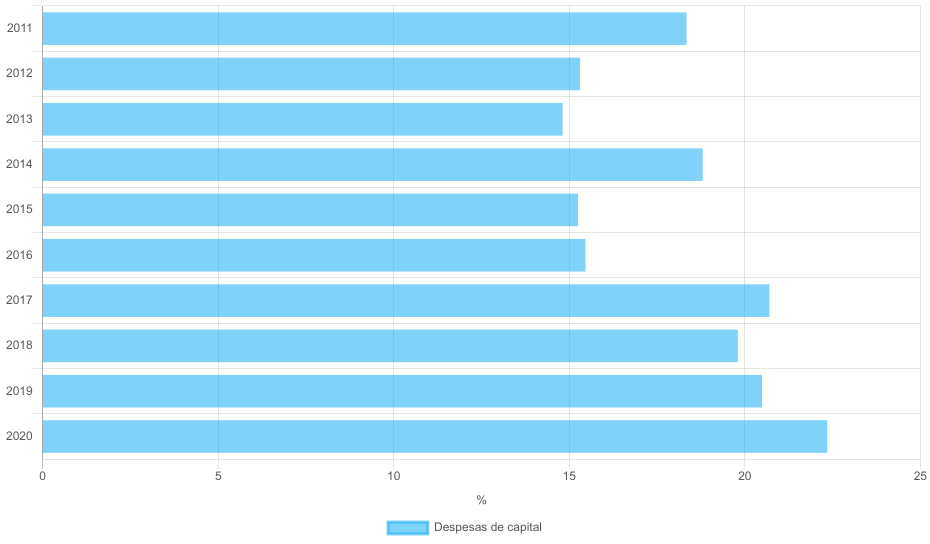
% Capital expenditure
Annual
