Despesas municipais em Ambiente por 1000 habitantes
Anual
Dados para
todas as localizações
em função de
domínios de ambiente
Zoom
Continente (€/ 1000 hab.)
60 698
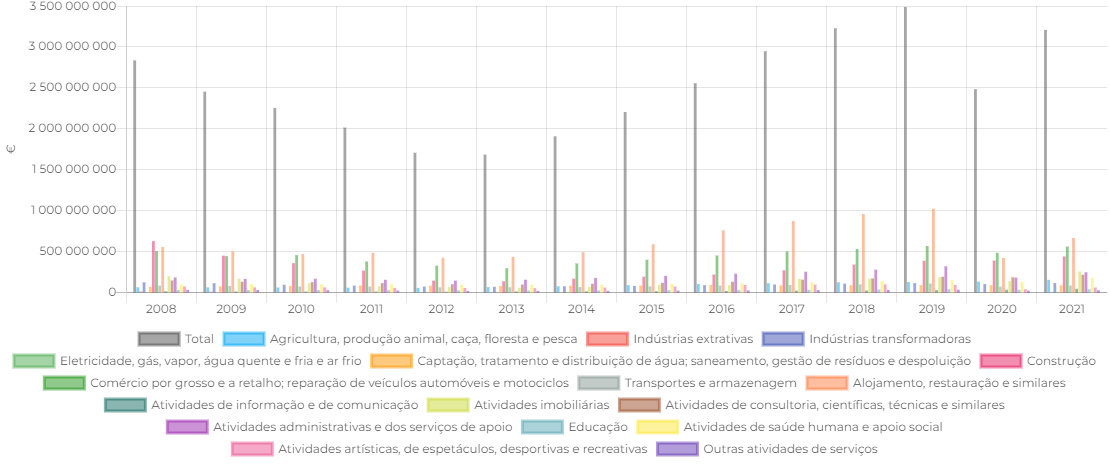
Despesas em ambiente dos municípios por 1000 habitantes, e respetivos domínios de ambiente (Protecção da qualidade do ar e clima; Gestão de águas residuais; Gestão de resíduos; Protecção e recuperação dos solos, de águas subterrâneas e superficiais; Protecção contra ruídos e vibrações; Protecção da biodiversidade e paisagem; Protecção contra radiações; Investigação e desenvolvimento; Outras atividades de protecção do ambiente).
-
Retirado das Estatísticas dos municípios em ambiente - série longa.
Euro/ 1000 habitantes (€/ 1000 hab.)
Anual
Resposta
INE
INE
1993 - 2022
| Anos | Total | Protecção da qualidade do ar e clima | Gestão de águas residuais | Gestão de resíduos | Protecção e recuperação dos solos, de águas subterrâneas e superficiais | Protecção contra ruídos e vibrações | Protecção da biodiversidade e paisagem | Protecção contra radiações | Investigação e desenvolvimento | Outras atividades de protecção do ambiente |
|---|---|---|---|---|---|---|---|---|---|---|
| 1993 | 72 147 | 24 | 38 165 | 31 358 | 278 | 0 | 2 120 | 0 | 0 | 202 |
| 1994 | 79 573 | 0 | 41 323 | 30 757 | 265 | 0 | 4 434 | 0 | 0 | 2 794 |
| 1995 | 79 711 | 0 | 39 175 | 30 365 | 0 | 0 | 5 836 | 0 | 0 | 4 335 |
| 1996 | 87 714 | 0 | 45 467 | 33 574 | 0 | 0 | 4 600 | 0 | 0 | 4 073 |
| 1997 | 99 629 | 0 | 49 342 | 40 209 | 0 | 0 | 4 872 | 0 | 0 | 5 206 |
| 1998 | 88 010 | 0 | 41 362 | 34 642 | 0 | 0 | 8 010 | 0 | 0 | 3 996 |
| 1999 | 99 866 | 0 | 45 380 | 41 608 | 27 | 26 | 8 864 | 0 | 0 | 3 961 |
| 2000 | 133 903 | 0 | 76 713 | 55 756 | 0 | 0 | 1 372 | 0 | 0 | 62 |
| 2001 | 153 446 | 0 | 76 567 | 63 411 | 0 | 0 | 13 088 | 0 | 0 | 380 |
| 2002 | 117 280 | 0 | 43 240 | 63 346 | 674 | 0 | 10 020 | 0 | 0 | 0 |
| 2003 | 127 616 | 0 | 53 663 | 54 933 | 797 | 26 | 16 869 | 0 | 0 | 1 328 |
| 2004 | 133 572 | 0 | 51 636 | 65 365 | 0 | 201 | 14 940 | 0 | 0 | 1 430 |
| 2005 | 123 786 | 0 | 49 811 | 54 533 | 0 | 108 | 15 493 | 0 | 0 | 3 841 |
| 2006 | 79 959 | 2 | - | 60 316 | 159 | 74 | 16 643 | 0 | 81 | 2 684 |
| 2007 | 84 625 | 0 | - | 66 668 | 0 | 46 | 15 870 | - | 0 | 2 041 |
| 2008 | 93 180 | 0 | - | 70 871 | 37 | 99 | 20 414 | - | 5 | 1 754 |
| 2009 | 90 773 | 0 | - | 67 405 | 0 | 103 | 20 151 | - | 3 | 3 111 |
| 2010 | 76 559 | 0 | - | 58 743 | 0 | 107 | 15 467 | - | - | 2 242 |
| 2011 | 77 501 | 0 | - | 60 584 | 0 | 224 | 14 180 | - | 12 | 2 501 |
| 2012 | 71 020 | 0 | - | 54 086 | 0 | 61 | 14 008 | - | 13 | 2 852 |
| 2013 | 82 220 | 0 | - | 64 429 | 0 | 74 | 14 485 | - | 6 | 3 226 |
| 2014 | 76 726 | 0 | - | 55 360 | - | 54 | 19 431 | - | 7 | 1 874 |
| 2015 | 83 697 | 0 | - | 52 552 | 0 | 41 | 29 432 | - | 0 | 1 672 |
| 2016 | 84 554 | 0 | - | 60 473 | 0 | 40 | 22 981 | - | 0 | 1 060 |
| 2017 | 94 350 | 0 | - | 61 736 | 0 | 55 | 31 044 | - | 0 | 1 515 |
| 2018 | 102 375 | 998 | - | 63 350 | 0 | 59 | 36 289 | - | 0 | 1 679 |
| 2019 | 117 832 | 987 | - | 74 240 | 0 | 94 | 41 120 | - | 0 | 1 391 |
| 2020 | 120 419 | 1 878 | - | 73 172 | 0 | 116 | 43 695 | - | 0 | 1 558 |
| 2021 | 131 112 | 1 019 | - | 88 248 | 155 | 123 | 40 629 | - | 0 | 938 |
| 2022 | 141 613 | 844 | - | 101 896 | 157 | 161 | 37 344 | - | 0 | 1 211 |


