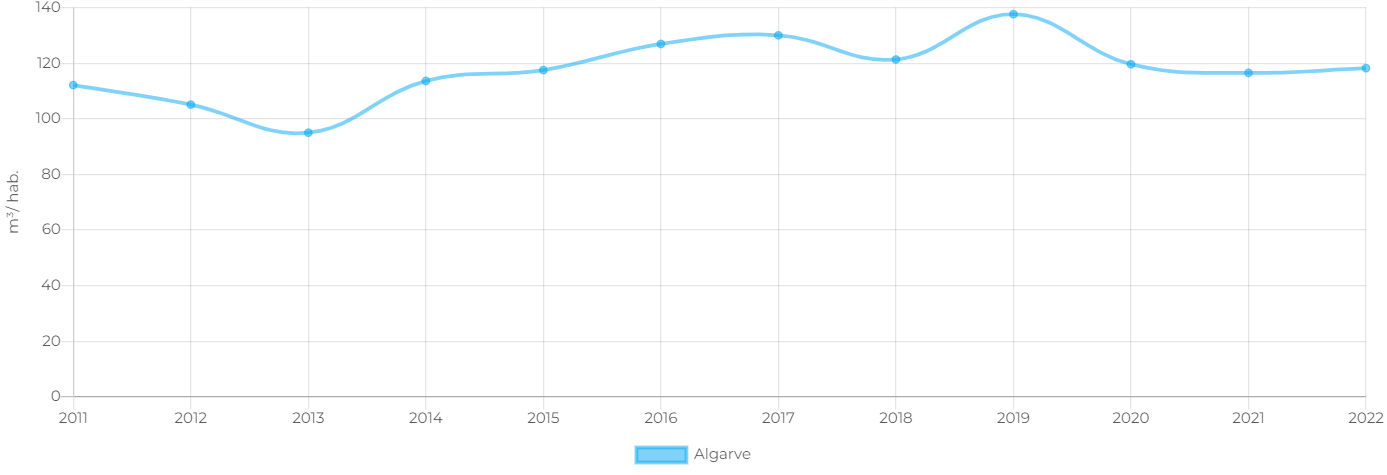
Environmental expenditure of municipalities by 1000 inhabitants
Annual
Data for
Algarve
as a function of
environmental domain
Zoom
Continente (€/ 1000 inhab.)
60,698
Environmental expenditure of municipalities by 1000 inhabitants, and respective environmental domain (Protection of ambient air and climate; Wastewater management; Waste management; Protection and remediation of soil, groundwater and surface water; Noise and vibration abatement; Protection of biodiversity and landscape; Protection against radiation; Research and development; Other environmental protection activities).
-
Retrieved from Statistics of the municipalities in environment - long series.
Euro/ 1000 inhabitants (€/ 1000 hab.)
Annual
Response
INE
INE
1993 - 2022
| Years | Protection of ambient air and climate | Wastewater management | Waste management | Protection and remediation of soil, groundwater and surface water | Noise and vibration abatement | Protection of biodiversity and landscape | Protection against radiation | Research and development | Other environmental protection activities |
|---|---|---|---|---|---|---|---|---|---|
| 1993 | 24 | 38,165 | 31,358 | 278 | 0 | 2,120 | 0 | 0 | 202 |
| 1994 | 0 | 41,323 | 30,757 | 265 | 0 | 4,434 | 0 | 0 | 2,794 |
| 1995 | 0 | 39,175 | 30,365 | 0 | 0 | 5,836 | 0 | 0 | 4,335 |
| 1996 | 0 | 45,467 | 33,574 | 0 | 0 | 4,600 | 0 | 0 | 4,073 |
| 1997 | 0 | 49,342 | 40,209 | 0 | 0 | 4,872 | 0 | 0 | 5,206 |
| 1998 | 0 | 41,362 | 34,642 | 0 | 0 | 8,010 | 0 | 0 | 3,996 |
| 1999 | 0 | 45,380 | 41,608 | 27 | 26 | 8,864 | 0 | 0 | 3,961 |
| 2000 | 0 | 76,713 | 55,756 | 0 | 0 | 1,372 | 0 | 0 | 62 |
| 2001 | 0 | 76,567 | 63,411 | 0 | 0 | 13,088 | 0 | 0 | 380 |
| 2002 | 0 | 43,240 | 63,346 | 674 | 0 | 10,020 | 0 | 0 | 0 |
| 2003 | 0 | 53,663 | 54,933 | 797 | 26 | 16,869 | 0 | 0 | 1,328 |
| 2004 | 0 | 51,636 | 65,365 | 0 | 201 | 14,940 | 0 | 0 | 1,430 |
| 2005 | 0 | 49,811 | 54,533 | 0 | 108 | 15,493 | 0 | 0 | 3,841 |
| 2006 | 2 | - | 60,316 | 159 | 74 | 16,643 | 0 | 81 | 2,684 |
| 2007 | 0 | - | 66,668 | 0 | 46 | 15,870 | - | 0 | 2,041 |
| 2008 | 0 | - | 70,871 | 37 | 99 | 20,414 | - | 5 | 1,754 |
| 2009 | 0 | - | 67,405 | 0 | 103 | 20,151 | - | 3 | 3,111 |
| 2010 | 0 | - | 58,743 | 0 | 107 | 15,467 | - | - | 2,242 |
| 2011 | 0 | - | 60,584 | 0 | 224 | 14,180 | - | 12 | 2,501 |
| 2012 | 0 | - | 54,086 | 0 | 61 | 14,008 | - | 13 | 2,852 |
| 2013 | 0 | - | 64,429 | 0 | 74 | 14,485 | - | 6 | 3,226 |
| 2014 | 0 | - | 55,360 | - | 54 | 19,431 | - | 7 | 1,874 |
| 2015 | 0 | - | 52,552 | 0 | 41 | 29,432 | - | 0 | 1,672 |
| 2016 | 0 | - | 60,473 | 0 | 40 | 22,981 | - | 0 | 1,060 |
| 2017 | 0 | - | 61,736 | 0 | 55 | 31,044 | - | 0 | 1,515 |
| 2018 | 998 | - | 63,350 | 0 | 59 | 36,289 | - | 0 | 1,679 |
| 2019 | 987 | - | 74,240 | 0 | 94 | 41,120 | - | 0 | 1,391 |
| 2020 | 1,878 | - | 73,172 | 0 | 116 | 43,695 | - | 0 | 1,558 |
| 2021 | 1,019 | - | 88,248 | 155 | 123 | 40,629 | - | 0 | 938 |
| 2022 | 844 | - | 101,896 | 157 | 161 | 37,344 | - | 0 | 1,211 |

