Taxa de abstenção
Não periódico
Dados para
Algarve
em função de
taxa de abstenção
Zoom
Câmaras Municipais em Portugal (%)
45
Relação percentual entre o número de abstenções e o número de eleitores residentes inscritos.
-
-
Percentagem (%)
Não periódico
Estado
Ministério da Administração Interna
INE
2001 - 2022
| Anos | Câmaras municipais | Assembleia da República | Presidência da República | Parlamento Europeu |
|---|---|---|---|---|
| 2001 | 42,2 | - | 52,5 | - |
| 2002 | - | 41,6 | - | - |
| 2004 | - | - | - | 67,9 |
| 2005 | 42,4 | 38,4 | - | - |
| 2006 | - | - | 40,1 | - |
| 2009 | 43,3 | 42,7 | - | 67,5 |
| 2011 | - | 44,2 | 56,1 | - |
| 2013 | 52,4 | - | - | - |
| 2014 | - | - | - | 71,5 |
| 2015 | - | 48,6 | - | - |
| 2016 | - | - | 55,7 | - |
| 2017 | 52,6 | - | - | - |
| 2019 | - | 54,2 | - | 73,1 |
| 2021 | 54,2 | - | 57,9 | - |
| 2022 | - | 48,7 | - | - |
Quem viu este indicator também viu:
0
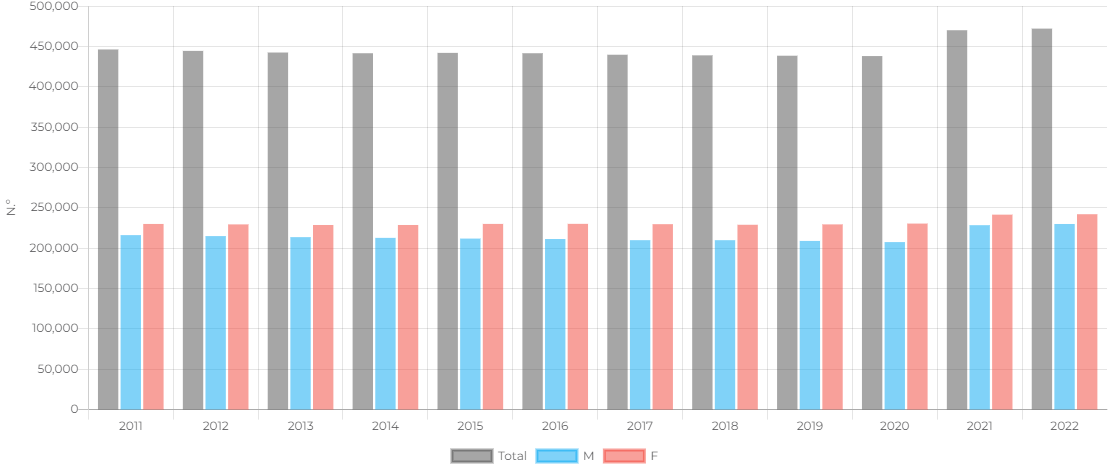
População residente
Anual
0
Pré-visualização indisponível
Postos de carregamento para veículos elétricos
Não periódico
